Visualizing Monika Data with Prometheus and Grafana
Star (0)Grafana is an open source visualization and analytics software. It allows you to query, visualize, be alerted, and explore your metrics no matter where they are stored. In plain English, it provides you with tools to turn your time-series database (TSDB) data into beautiful graphs and visualizations. It will be used to visualize your Monika data that has been processed by Prometheus.
Install Grafana
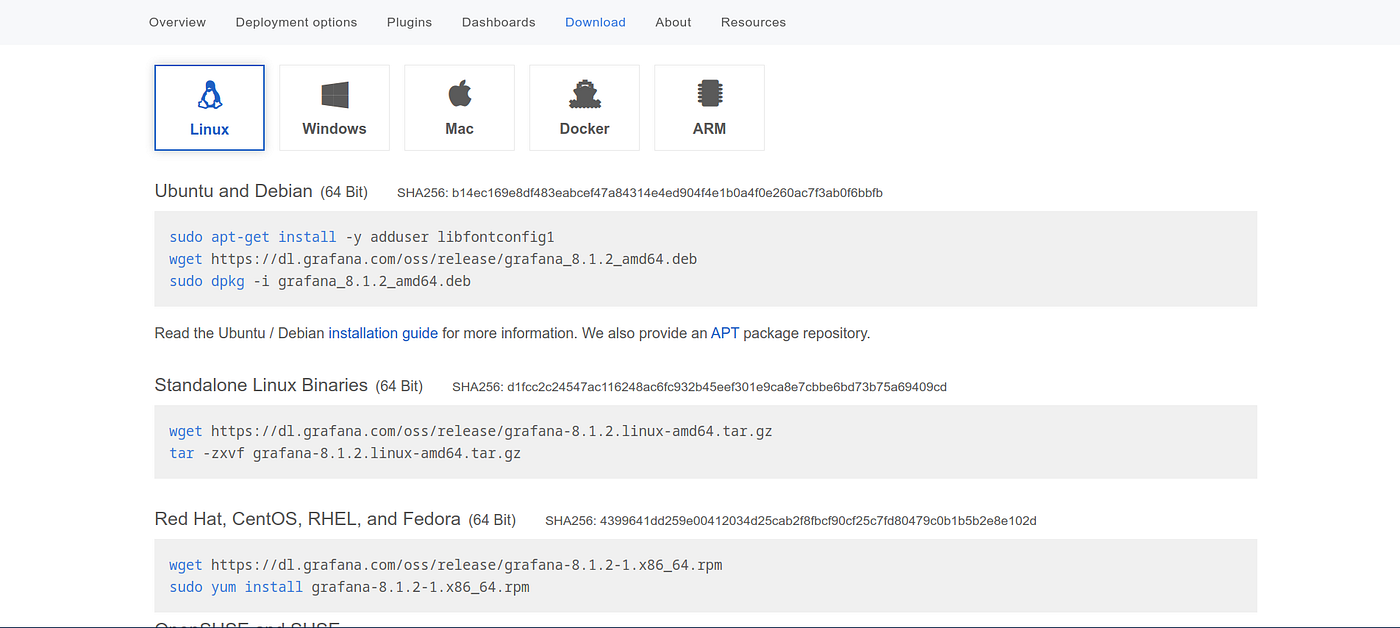
Let’s assume that you already have Monika and Prometheus installed and connected. The next step is we need to install Grafana. Head to the Downloads page and select which OS you are using.
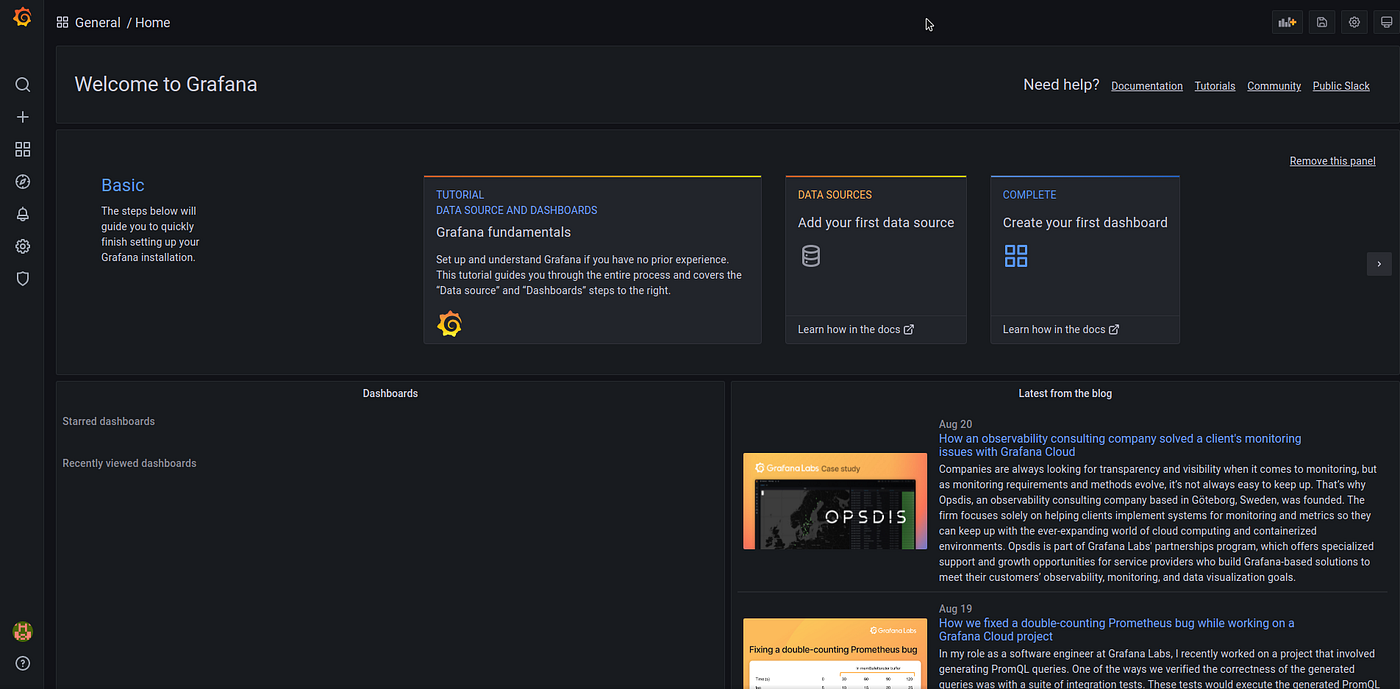
After you installed Grafana, open your web browser and go to http://localhost:3000/. The default HTTP port that Grafana listens to is 3000 unless you have configured a different port. It should show you the login page. On the login page, enter admin for username and password. After you are logged in, you will see the prompt to change your default password. Change your default password, and submit. You are now on the Grafana home page.
Configure the Data Source
Before we configure the data source, we need to run Monika and Prometheus. In case you forgot, here are the commands to run Monika and Prometheus both locally or using Docker:
_\# Run Monika\# If you're installing Monika locally_**monika -c monika.json --prometheus 3001**_\# Or if you're using Docker_**docker run --name monika \\-p 3001:3001 \\-v ${PWD}/monika.json:/config/monika.json \\--prometheus 3001 \\--detach hyperjump/monika:latest**_\# Run Prometheus\# If you're installing Prometheus locally_**./prometheus --config.file=prometheus.yml**_\# Or if you're using Docker_**docker run -d --name prometheus \\-p 9090:9090 \\-v <PATH\_TO\_prometheus.yml>:/etc/prometheus/prometheus.yml \\prom/prometheus --config.file=/etc/prometheus/prometheus.yml**
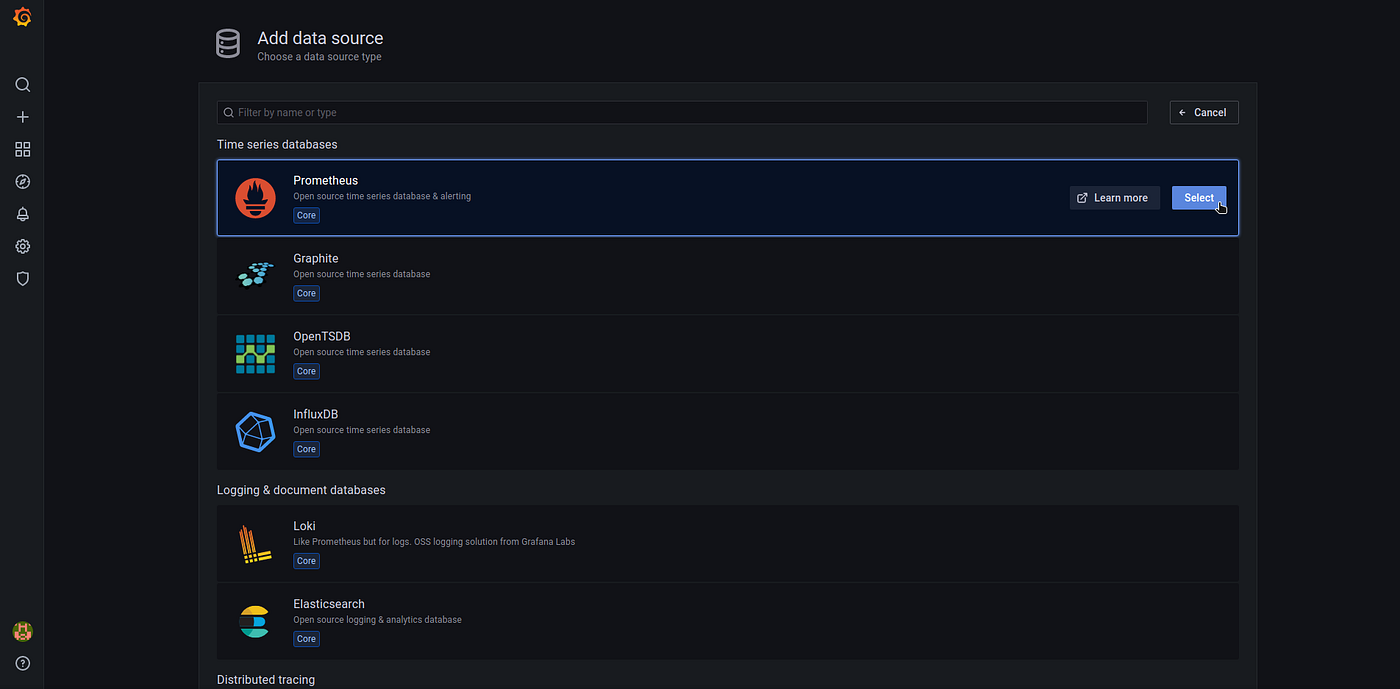
Back to the Grafana home page. On the left sidebar, hover the gear icon and select the Data Source option. Add a new data source by clicking the blue “Add data source” button. Then, select Prometheus as your data source.
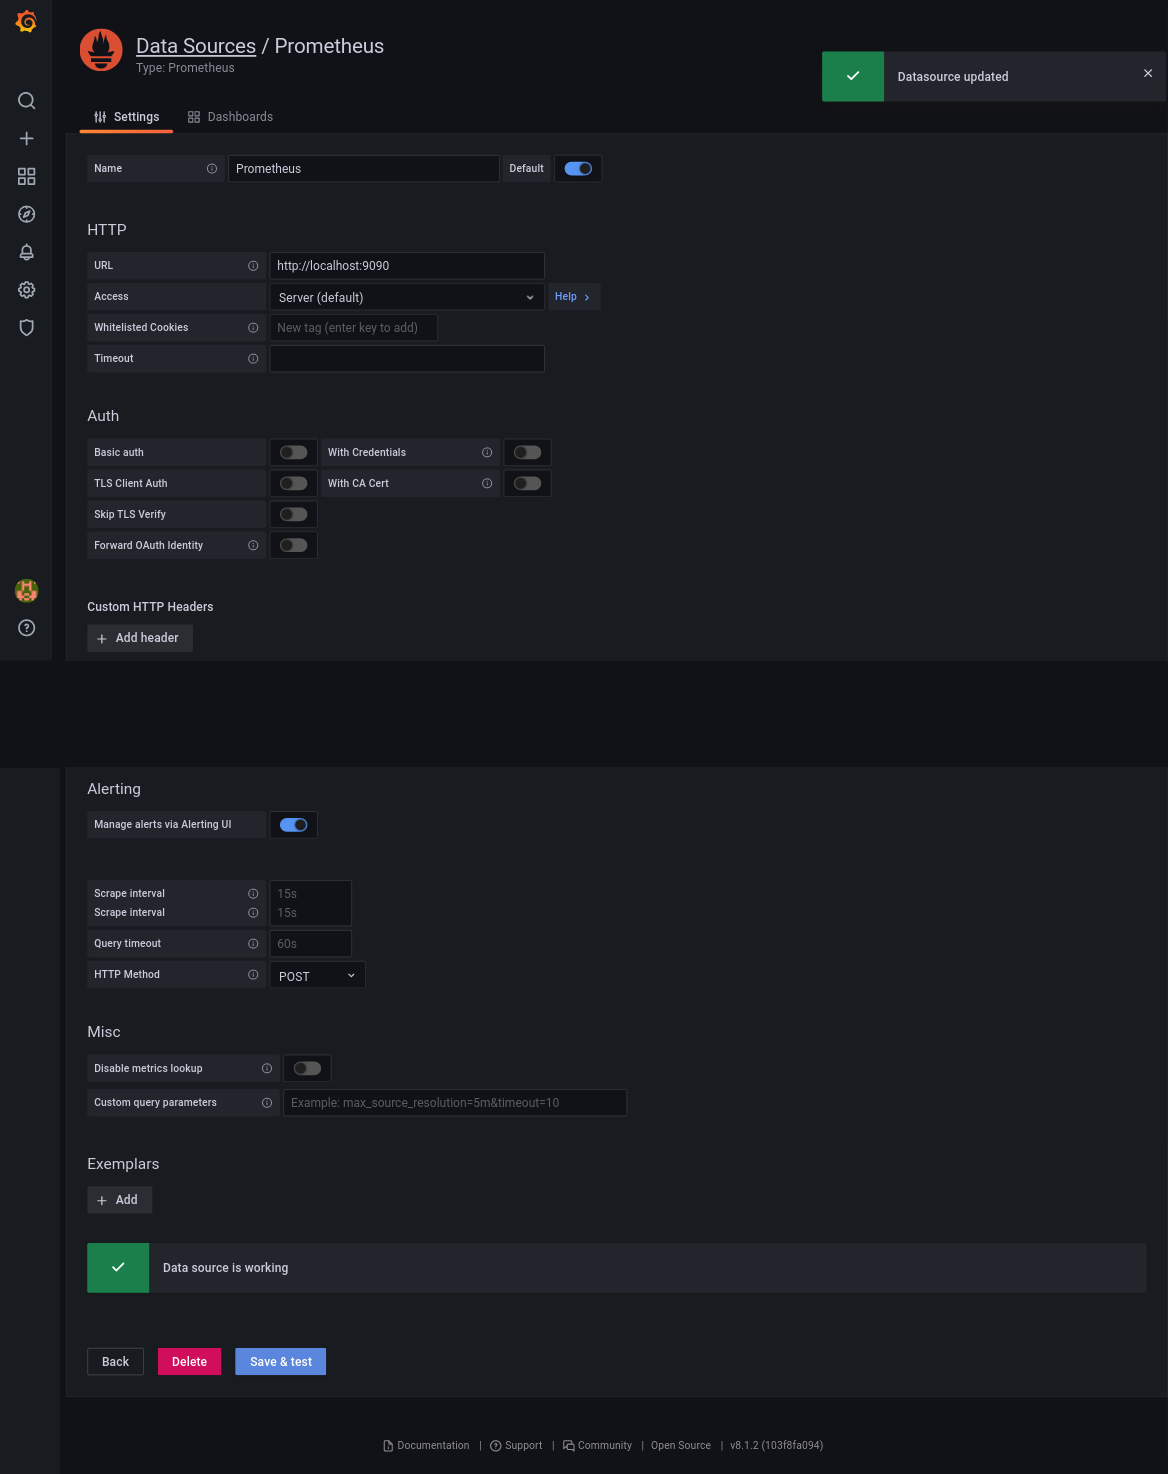
If you are following the instructions from the previous article, you are running Prometheus in port 9090. Fill out the URL with http://localhost:9090 and click the Save and Test button. It should display a toast notification telling that the data source has been updated.
Creating the Dashboard
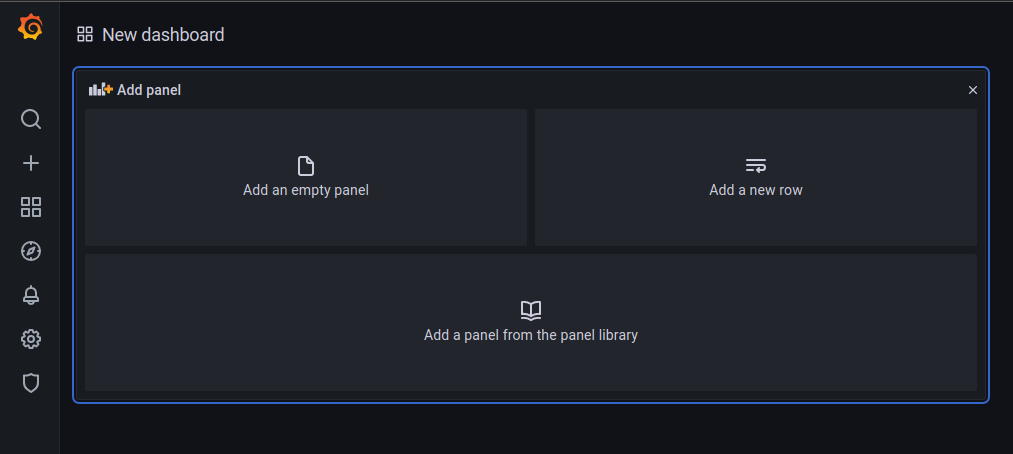
After the data source has been successfully added, hover over the plus icon sub-menu and select the Dashboard option. And then, click the “Add an Empty Panel” area. We are now going to create a probe status code information panel.
You are now on the edit panel page. In the right top section of the page, change the “Time Series” dropdown to “Stat”. Then, navigate to the metrics browser input field, type monika_request_status_code_infoand press Shift + Enter. After that, on the right sidebar, change the Panel Title to “Probe Status Code” and scroll down to the Threshold section. Set the color red threshold to 500. Now it should look like this:

Apply the changes, and we are halfway done. Next, we are going to create another panel for monitoring the average response time per 5 minutes.
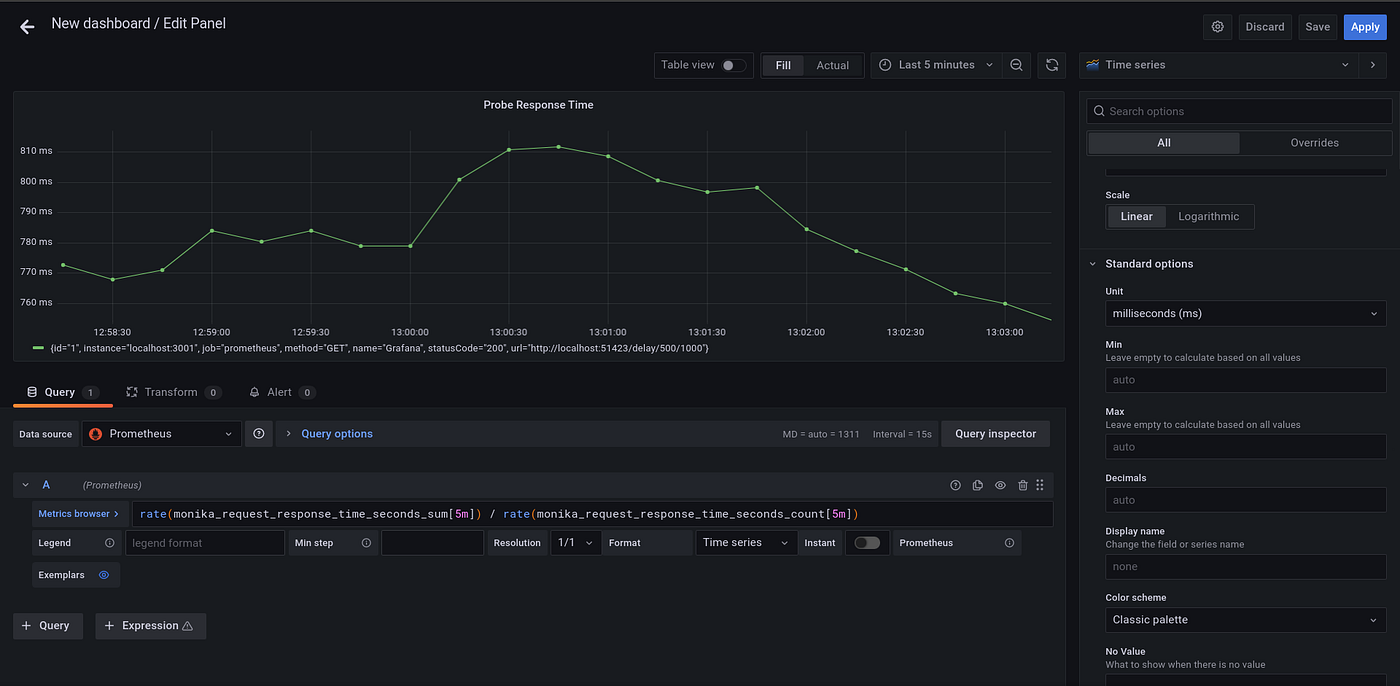
Create another panel in the current dashboard. Navigate to the metrics browser input field, type this in one line, and press Shift + Enter:
rate(monika\_request\_response\_time\_seconds\_sum\[5m\]) / rate(monika\_request\_response\_time\_seconds\_count\[5m\])
After that, on the right sidebar, change the Panel Title to “Probe Average Response Time”. Then on the right sidebar, scroll down to the “Standard Options” section and change the unit to “Milliseconds”. Apply the changes, and you’re done!
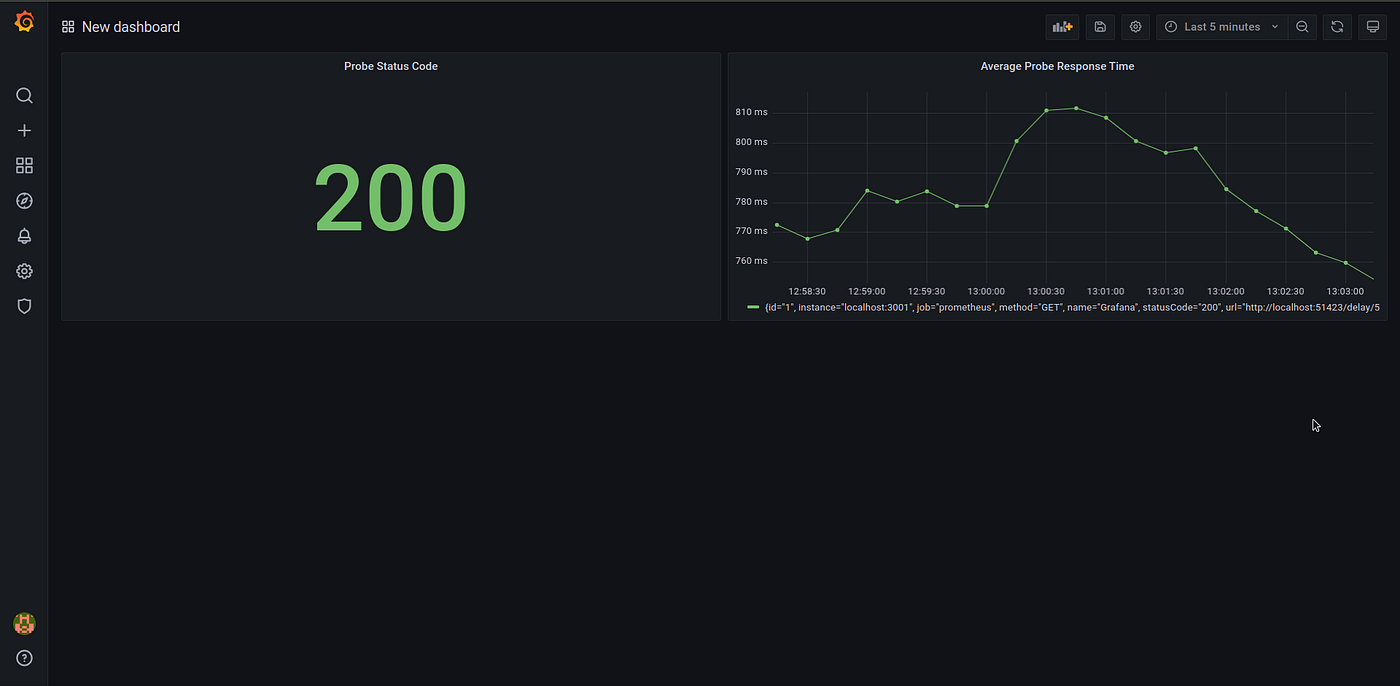
Congratulations! Now that you have successfully integrated Monika with Prometheus and Grafana, you will be notified if your website is slow or down.


PT Artha Rajamas Mandiri (Hyperjump) is an open-source-first company providing engineering excellence service. We aim to build and commercialize open-source tools to help companies streamline, simplify, and secure the most important aspects of its modern DevOps practices.
Copyright © 2026 Hyperjump Tech. All Rights Reserved.